True-Size Maps in Curriculum: Unpacking Hidden Hierarchy Lessons
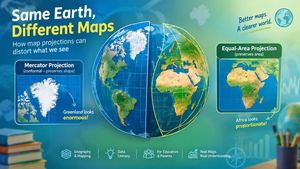
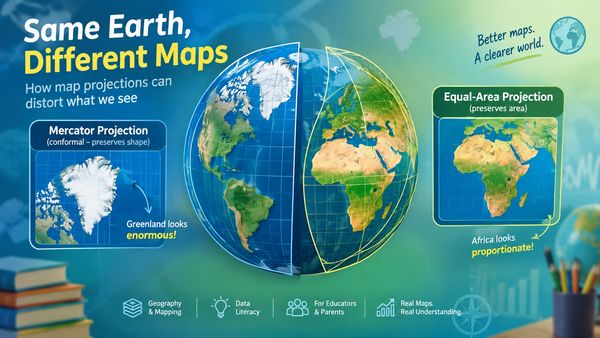 Exploring the visual impact of map projections on geographic understanding and curriculum design.The image illustrates the visual impact of map projections on geographic understanding and curriculum design.
Introduction: Why a World Map Is Never Just a Picture
A world map, so often taken for granted, projects an air of undeniable authority, partly because its conventions are so familiar that they can appear self-evident. We see the tidy grid of longitude and latitude, the familiar continental outlines, and assume a neutral, unwavering depiction of our planet. Yet, the moment our three-dimensional Earth is translated onto a flat, two-dimensional surface, an unavoidable series of choices comes into play: which fundamental geographic properties—direction, area, distance, or shape—will be preserved, and which will inevitably be sacrificed or distorted? The U.S. Geological Survey makes this fundamental problem exceptionally clear, stating unequivocally that no flat map can rival a globe in truly representing the entire Earth accurately, and every single flat map will, by its very nature, misrepresent the surface in some way [1].
That technical reality has a practical educational implication. A child who is consistently exposed to one singular map projection might absorb more than just the locations of countries. They might also internalize subtle, often unspoken, lessons about relative size, the perceived center of the world, and which regions are visually foregrounded as seemingly more significant. While it would be an oversimplification—and indeed, an unsupported claim—to assert that a specific projection automatically instills prejudice or dictates a student's political worldview, the evidence does not support such a simplistic cause-and-effect relationship. It is far more accurate to recognize that these repeated visual conventions can calcify into invisible assumptions, and that the crucial role of map education is to bring these assumptions into the light, making them discussable and debatable.
This article delves into the pedagogical strategies required to teach this critical distinction. We'll explore the intricate mathematics and rich history behind the ubiquitous Mercator projection, contrasting it with alternatives like the Gall–Peters and Equal Earth projections. We'll identify and debunk common misconceptions, and, perhaps most practically, offer a sequenced approach for seamlessly integrating projection literacy into existing geography, history, and media literacy curricula, as well as into family learning environments.
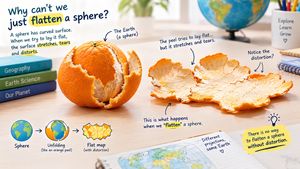 The challenge of flattening a sphere: why every map projection involves distortion.The image demonstrates the inherent distortion when translating a sphere to a 2D surface.
What Is the Hidden Curriculum of a Map?
Can a map—a seemingly objective tool—communicate a hierarchy without ever explicitly stating which places are more important? The idea of curriculum extends beyond an explicit syllabus of facts, skills, dates, and assessments. Classroom routines and recurring examples can also shape what students learn to notice and treat as important. This often happens through repetition: which geographical locations are consistently featured in examples, whose names are frequently pronounced, which regions are selected for in-depth case studies, and, critically, which visual conventions are presented as the unquestioned norm. This broader, often implicit, learning process is commonly discussed as a “hidden curriculum.” The concept is not specific to cartography, but it provides a useful lens for examining repeated classroom conventions.
A map projection can inadvertently participate in this process without any intentional message from its creator. If a map exaggerates the apparent size of high-latitude landmasses, a viewer can mistake visual prominence for geographic magnitude. The map itself doesn't explicitly declare Greenland, Canada, or Northern Europe as more significant; yet, a direct visual comparison can be profoundly misleading when the objective is to assess actual land area. The responsible educational response isn't to impute malicious motives to every mapmaker, but rather to equip students with the critical tools to ask pointed questions: what does this map preserve, and what, by its very design, does it sacrifice?
A crucial distinction to impart here is between representation and interpretation. The representation is a purely mathematical act: a projection is a calculated transformation of coordinates from a curved sphere or ellipsoid onto a flat plane. The interpretation, however, is deeply social: it's the viewer's individual and collective decision about what the resulting visual pattern signifies. Educators must be explicit about this boundary. A distorted area on a map does not automatically prove a distorted, prejudiced intention behind its creation, just as a more accurately proportionate map does not, in isolation, conjure a more equitable society.
Refine Critical Inquiry
When a child inquires if a map is 'right,' pivot from a simple yes-or-no answer. Instead, ask them three guiding questions: Right for what specific purpose? Which geographic property does this particular map preserve? And what, consequently, does it inevitably distort?
How Does the Mercator Projection Work?
To truly understand the Mercator projection, we have to journey back to 1569, the year Gerardus Mercator unveiled his groundbreaking world map. His projection rapidly ascended to prominence specifically because of its unparalleled utility for navigation. Its key navigational property is that lines of constant bearing, known as rhumb lines, appear as straight lines on the projection. The USGS explains that the basic Mercator projection shows true direction along straight lines, making it useful for navigation [1].
Technically, Mercator is a conformal projection. This means it preserves local angles and, as a direct consequence, maintains the shapes of small areas reasonably well. However, its scale dramatically increases with latitude. In its simplified spherical form, the linear scale factor expands in proportion to 1/cos(latitude), meaning it gets progressively larger as a location approaches either the North or South Pole. At 60 degrees latitude, for instance, the scale factor is approximately two; near the poles, it mathematically tends toward infinity. The direct, undeniable result of this mathematical behavior is that landmasses situated at high latitudes appear vastly larger than their actual surface areas [1][3].
This mathematical underpinning is the critical nuance often overlooked in popular discussions: the Mercator projection isn't inherently a 'bad map' in every conceivable context. It is, unequivocally, a specialized tool, endowed with a clear and potent strength. A nautical chart, designed for precise maritime routes, demands different properties than a global thematic map illustrating population density. The very same projection can be perfectly appropriate and incredibly useful in one specific context, yet profoundly misleading in another. Understanding this contextual dependency is key to true map literacy.
What does the distortion look like?
The familiar Greenland–Africa comparison illustrates the effect clearly: Mercator greatly exaggerates the apparent area of high-latitude Greenland relative to equatorial Africa. In reality, Africa is roughly fourteen times larger by area than Greenland. The precise visual comparison depends on the particular map and its rendering, so the ratio should be treated as an area fact rather than as a property of every printed Mercator map. This colossal discrepancy is a consequence of the distortion that occurs when the three-dimensional Earth is represented on a flat map: the Mercator projection distorts the relative size of landmasses, exaggerating the size of land near the poles compared with areas near the equator [3].
However, educators must wield this comparison with care. It’s crucial to understand that the map doesn’t exaggerate every high-latitude object equally, and the precise visual appearance is influenced by the projection's specific implementation, its latitude limits, how it's cropped, and its overall visual design. Teachers should also vigilantly avoid framing this comparison as definitive proof that the map was intentionally designed to diminish Africa. The area distortion is a scientifically demonstrable fact; however, claims about a map's hidden intent or its psychological impact on viewers demand entirely separate, robust evidence. Without such evidence, such claims remain speculative and undermine the objective understanding of cartographic principles.
Compare and Contrast Effectively
Present a Mercator map alongside a physical globe or an equal-area projection. Challenge students to pinpoint Mercator's strengths—its preservation of direction and local angles—and its weaknesses—its unreliable global area comparisons.
Are Gall–Peters and Equal Earth ‘True-Size’ Maps?
What does ‘equal-area’ actually mean?
When we speak of an “equal-area projection,” we're referring to a map design that preserves relative area. This means that areas are represented in proportion to their actual relative sizes, even though other properties, such as shape, may be distorted. This property makes equal-area projections useful when preserving relative area is important. The USGS identifies equal-area projections among those used in the National Atlas, illustrating how different projections are selected for different mapping purposes [1][2].
Yet, it’s a crucial misconception to equate 'equal-area' with 'distortion-free.' The immutable laws of cartography dictate a fundamental trade-off: a flat map simply cannot simultaneously preserve area, shape, distance, and direction everywhere across its surface. Consequently, equal-area projections must, by their very nature, distort shapes to maintain accurate area relationships. The USGS notes that shapes are more or less distorted on every equal-area map, even though these projections preserve the relative sizes of areas [1].
How is the Gall–Peters projection different?
The Gall–Peters projection stands as a prominent example of a cylindrical equal-area projection, characterized by its standard parallels fixed at 45 degrees north and south. While it rigorously preserves relative area, it generates pronounced shape distortion, particularly for regions located further away from these standard parallels. Gall–Peters has been used in educational contexts and became part of wider debates about how world maps represent relative area. Its defining cartographic property, however, is technical: it preserves relative area while introducing substantial shape distortion away from its standard parallels.
In a classroom setting, the most productive approach to Gall–Peters is comparative rather than purely celebratory. Students can readily observe how Gall–Peters effectively corrects one critical problem—that of relative area—while simultaneously introducing or accentuating another, namely shape distortion. This nuanced understanding proves far more enduring and valuable than simply categorizing one projection as morally 'correct' and another as morally 'wrong.' The goal is not to declare a winner, but to illuminate the inherent compromises in mapmaking.
What makes Equal Earth different?
Enter the Equal Earth projection, a more recent innovation developed by the collaborative efforts of Bojan Šavrič, Tom Patterson, and Bernhard Jenny, and formally published in the International Journal of Geographical Information Science. This projection is a sophisticated equal-area pseudocylindrical design, drawing inspiration, in part, from the visual equilibrium of the Robinson projection, all while steadfastly preserving relative area [5].
Equal Earth represents a deliberate attempt to marry accurate area representation with continent outlines that many viewers find more aesthetically pleasing and recognizable than those produced by some older cylindrical equal-area projections. Its distinctive curved outer meridians and straight parallels forge a global appearance that markedly differs from both Mercator and Gall–Peters. The underlying design philosophy isn't to somehow eliminate distortion entirely; rather, it's to craft an area-preserving trade-off that is both cartographically sound and visually intuitive, thereby maximizing its utility and accessibility for a broader audience [5].
Embrace Nuanced Terminology
Shift from calling maps 'perfect' to using precise terms like 'equal-area projection.' Then, challenge students to articulate the trade-off in a single sentence: for example, 'Equal Earth preserves area, but it necessarily distorts some shapes, distances, or directions.'
Does Using Mercator Reinforce a Eurocentric Worldview?
What can be established—and what remains unproven?
The available cartographic sources support several specific statements about the Mercator projection. The USGS explains that the Mercator projection is useful for navigation because it shows true direction, while distances and areas become increasingly distorted toward the polar regions. The source also emphasizes that different map projections serve different purposes, with some projections better suited to navigation and others better suited to representing the relative sizes of continents [1]. Furthermore, it is entirely reasonable and academically sound to investigate how such a deeply ingrained map convention might interact with existing societal habits, such as the historical tendency to center Europe on world maps or to universally orient the northern hemisphere at the 'top.'
The projection’s area distortion, by itself, does not establish that students will perceive the Global South as less important. Establishing such an educational or psychological effect would require direct empirical evidence. Student perception is a complex tapestry woven from countless threads: personal family experiences, linguistic frameworks, the content of textbooks, the dynamics of classroom discussions, broader media narratives, prevailing economic structures, historical accounts, and, crucially, the selective choice of examples presented in educational materials. While a projection certainly contributes to the overarching visual environment, it fundamentally fails as a standalone, singular explanation for intricate and deeply rooted attitudes or biases.
Understanding this critical distinction actually strengthens the educational imperative. An educator does not need to conclusively 'prove' that a map caused bias before empowering students to critically inspect it. The educational goal is geographic literacy: students should understand that a map projection is a set of choices about which geographic properties to preserve and which to distort.
Why does orientation matter?
Placing north at the top of a map is a convention rather than a physical requirement. In the vastness of space, Earth has no inherent 'top' or 'bottom.' Consequently, maps can be fruitfully centered on different longitudes or oriented in entirely different directions. A south-up map, a Pacific-centered map, or various polar projections can make different geographic relationships more visually prominent in a conventional, Atlantic-centered layout. However, it's crucial to understand that simply altering a map's orientation doesn't automatically confer greater accuracy; rather, it fundamentally reconfigures the viewer's spatial frame of reference, prompting new insights and challenging ingrained perspectives.
This 'edge case' holds significant weight for both families and educators: a map can be meticulously equal-area and yet still perpetuate subtle biases by disproportionately centering one region, carelessly cropping another, employing an unhelpful or confusing color scheme, or placing labels in such a way that certain places become unduly difficult to locate. Therefore, projection literacy, while vital, constitutes only one facet—albeit a crucial one—of a truly comprehensive critical map literacy. The discerning map reader must look beyond the projection formula alone.
Deconstruct Map Choices
Instead of immediately asking students to label a map 'biased,' guide them to inventory its fundamental choices: the specific projection used, its chosen center, its orientation, the scale, how it's cropped, its labels, color palette, and, most importantly, its intended purpose.
How Can Families and Schools Teach Projection Literacy?
Step 1: Begin with a globe and a prediction
Before introducing any alternative flat maps, engage learners by asking them to predict what would happen if a spherical orange peel were flattened. This hands-on activity, while not a mathematically precise demonstration of map projection, makes the core problem tangibly evident: a curved surface cannot be laid flat without inevitably tearing, stretching, compressing, or cutting it. For a general view of Earth’s surface, a globe avoids the global projection distortions inherent in flat maps [1].
Step 2: Compare three projections
Display Mercator, Gall–Peters, and Equal Earth maps side-by-side, ensuring they are rendered at comparable sizes and feature consistent continent labels. Instruct learners to meticulously record all observable changes across the three. This comparative exercise should systematically examine alterations in area, shape, direction, the spacing of latitudes, the treatment of polar regions, and the overall visual balance. The educator's role is critical here: avoid any suggestion that these maps depict different planets; rather, emphasize that they are merely distinct mathematical representations of the same planet.
Step 3: Use a concrete area challenge
Provide students with physical cut-out silhouettes of key landmasses like Africa, Greenland, Australia, and Europe, or alternatively, utilize a digital equal-area map equipped with a measurement tool. Challenge them to estimate which regions are larger, then guide them to verify their estimations against a reliable, authoritative geographic dataset. The objective here isn't rote memorization of a single ratio; it's cultivating the profound understanding that visual size on a non-equal-area map is often an unreliable proxy for actual surface area.
Step 4: Connect maps to history
Integrate map projection into history lessons by exploring how the demands of navigation, global trade routes, empire building, scientific exploration, and state administration necessitated different types of maps throughout various eras. Students can investigate the historical reasons why a navigation-centric projection like Mercator gained widespread adoption in maritime contexts and subsequently permeated general reference materials. The teacher should consistently distinguish documented historical usage from unsubstantiated assertions about deliberate ideological design.
Step 5: Connect maps to digital technology
Digital mapping systems can use different projections or representations for different scales, regions, and tasks. For instance, a web map might employ a Mercator-derived system for efficient tiled display, while a globe view or a thematic data visualization could leverage an entirely different projection method. The core lesson is that map projections are selected according to the purposes they serve, the characteristics of the area being mapped, and practical considerations such as convenience and the use of mathematical calculations to produce projected coordinates [1][2].
Step 6: Assess explanation, not preference
An effective assessment strategy moves beyond merely asking students which map they 'like best.' Instead, it demands that they rigorously justify a cartographic choice. For example: "Choose a projection suitable for a map illustrating global forest cover and explicitly explain why area preservation is critical for this purpose," or "Select a projection for plotting a sailing route and explain why maintaining accurate direction is paramount." This approach effectively externalizes and makes visible the students' cartographic reasoning.
Implement Map Metadata
Mandate that every student-designed map includes a concise 'map metadata' box. This box should clearly list the projection used, the map's stated purpose, its data source, the date of creation, the scale, and any identified limitations, fostering rigorous cartographic practice.
What Are the Most Important Technical Nuances?
Beyond the broad strokes of map projection theory, several technical nuances—often overlooked 'edge cases'—are crucial for developing a truly sophisticated map literacy. Understanding these specific scenarios allows for a more robust and flexible application of cartographic principles, moving beyond simplistic generalizations.
1. Scale and Orientation Determine Mercator's Usefulness
The statement that “Mercator distorts everything” is too broad. The extent and nature of distortion are profoundly dependent on location, scale, aspect, and the map's specific purpose. For example, USGS notes that extreme high-latitude distortion on a small-scale world Mercator map can largely disappear on a properly oriented Transverse Mercator map of a smaller area. This example demonstrates that different projections can have different levels of usefulness depending on the map's scale, orientation, and intended purpose [1].
2. Equal-area does not preserve population density automatically
An equal-area base map helps preserve area relationships, but it does not by itself make a population-density map unbiased or analytically sound. A choropleth map, for example, can still introduce significant misleading impressions through its classification scheme, the colors chosen, missing data, or the use of overly large administrative units. A sparsely populated but geographically expansive region can visually dominate a map if the variable isn't appropriately normalized (e.g., population per square kilometer). Projection choice is a necessary step for certain tasks, but it is never, by itself, a sufficient condition for accurate or unbiased interpretation.
3. ‘True size’ is not the same as ‘true shape’
A persistent misconception is that equal-area maps, by preserving area relationships, also maintain the exact, familiar outline of every country. This is incorrect. If a student initially rejects an Equal Earth map because a familiar coastline appears stretched or compressed, this presents a valuable pedagogical opportunity. The teacher can use this moment to explicitly explain that shape and area are distinct cartographic properties. A map can be highly accurate for one type of measurement (e.g., area) while simultaneously being less accurate for another (e.g., shape fidelity).
4. The poles require special care
The standard Mercator projection fundamentally cannot represent the Earth's poles as finite points on the map—they are infinitely stretched. Consequently, polar regions are particularly susceptible to extreme visual exaggeration on such maps.
For polar studies, a projection designed for the region may be more appropriate than standard Mercator; the specific choice should depend on the task. The USGS emphasizes that projection suitability varies with purpose and scale [1].
5. A map can be mathematically sound but pedagogically poor
A projection can be entirely valid from a technical, mathematical standpoint, yet utterly fail in an educational context. This happens if labels overlap, the legend is unclear or confusing, the color scale implies a ranking that the underlying data doesn't support, or the map is simply printed at an unreadably small size. Accessibility is also a crucial, often overlooked, factor: color-blind-safe palettes, highly readable typography, the provision of alternative text descriptions, and even tactile or verbal descriptions can be the decisive elements in whether a map is truly usable and understood by a diverse group of learners.
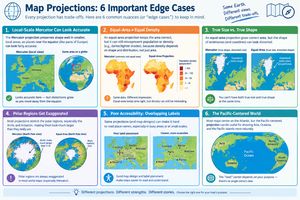 Delving into specific technical nuances and 'edge cases' that enrich our understanding of map projections.The image provides a visual representation of specific technical nuances and 'edge cases' that enrich our understanding of map projections.
6. Centering can change perceived relationships
The choice of a map's center profoundly influences which geographical relationships are most readily apparent to the viewer. For instance, a Pacific-centered map naturally emphasizes the Pacific Ocean as a central entity, rather than visually bisecting it at the map's edges. Similarly, an Africa-centered map can foster a dramatically different visual interpretation of historical trade routes or contemporary regional connections. While centering does not alter immutable geographic facts, it fundamentally reshapes which relationships become visually contiguous and therefore easier to perceive and analyze, offering fresh perspectives on global interactions.
Comprehensive Map Critique
Empower students to critique the entirety of a map's design, extending beyond merely its projection formula. A robust checklist should include projection, stated purpose, scale, chosen center, orientation, underlying data, classification methods, labels, accessibility features, and inherent limitations.
What Should Parents Look for in a Geography Textbook?
For parents navigating the educational landscape, discerning the quality of geography textbooks goes beyond simply checking for correct names and locations. A crucial first question to ask is whether a textbook explicitly names the projection used for its world maps. A map that omits this fundamental information isn't necessarily useless, but it represents a missed opportunity to impart a vital scientific convention and to foster critical thinking. Furthermore, parents should actively seek out textbooks that demonstrate variety in their cartographic representations: navigation maps, detailed regional maps, thematic maps, globes, high-resolution satellite imagery, and a range of alternative world projections should all be present and, critically, not treated as interchangeable depictions.
An exceptional educational resource will go a step further, meticulously explaining the rationale behind a map's selection. It won't merely swap one familiar projection for another and then deceptively label the new one as 'neutral' or 'perfect.' Instead, it will openly present the inherent trade-offs involved in mapmaking, employ accurate and unambiguous labels, scrupulously avoid sensationalist or unsubstantiated claims, and, most importantly, actively encourage students to verify their initial visual impressions against rigorous, independently verifiable geographic data.
Parents should exercise considerable caution when encountering viral graphics or social media posts that loudly proclaim a map 'proves' one region is secretly larger, more powerful, or inherently more important than another. While a map projection can certainly explain why a particular region might appear larger on paper, claims about political, economic, demographic, or cultural importance demand entirely different forms of evidence and analysis—evidence that extends far beyond a simple visual interpretation of an inherently distorted two-dimensional representation.
Engage in Purposeful Map Dialogue
Initiate simple yet profound conversations with your child. Ask them to articulate a specific map's purpose and one of its inherent limitations. Such a dialogue is far more enriching than mere rote memorization of projection names without a deeper understanding of their practical applications and constraints.
Expert Anchors: What Authoritative Sources Actually Say
In the often-heated discourse surrounding map projections, anchoring discussions in authoritative, scientific sources is paramount. The U.S. Geological Survey (USGS) provides an indispensable foundational principle in its educational guidance: "No flat map can rival a globe in truly representing the surface of the entire Earth" [1]. This statement is the ideal starting point for any neutral classroom discussion, as it frames the choice of map projection as an objective technical challenge rather than a subjective moral imperative. It establishes from the outset that distortion is an inescapable reality of flat maps.
The USGS further elucidates that different projections are designed to serve distinct purposes, ranging from the highly practical needs of navigation to the more abstract goal of accurately representing relative continental sizes [1]. This authoritative clarification directly supports a balanced and nuanced lesson: the Mercator projection, despite its visual distortions of area, possesses legitimate and valuable uses, particularly in navigation, while equal-area projections are demonstrably better suited for specific global comparisons where proportionate area is the critical factor. This perspective avoids demonizing one projection while blindly endorsing another.
Moreover, the peer-reviewed paper introducing the Equal Earth projection explicitly describes it as a novel equal-area pseudocylindrical world map that steadfastly retains relative area while concurrently striving for visually balanced continental outlines [5]. The authors' meticulous technical description provides far more robust evidence and insight than any promotional language that might suggest a projection can miraculously eliminate all forms of distortion. Their scientific rigor underscores the inherent trade-offs in map design.
Taken together, these sources support three practical points for map education: flat maps necessarily involve trade-offs; equal-area projections are useful when relative area is the property that matters; and claims about psychological or political effects require evidence beyond the mathematical properties of a projection. Speculation, however well-intentioned, must be distinguished from verifiable fact.
How Should a Curriculum Framework Be Built?
Developing a robust curriculum framework for teaching map projection literacy requires a systematic, progressive approach that moves beyond superficial comparisons. The goal is to cultivate deep understanding and critical thinking skills, enabling students to engage with maps as sophisticated tools rather than mere pictures. A well-designed sequence, focusing on core questions and active learning, is essential.
A six-lesson sequence
This structured approach ensures that students gradually build their understanding from fundamental concepts to advanced critical analysis:
- Lesson 1: The impossible flat map
- Core question: Why can’t a globe be flattened perfectly?
- Activity: Use a globe and an orange-peel analogy, asking students to journal their predictions.
- Evidence of learning: Student names at least two properties (e.g., area, shape) that inevitably get distorted when flattening a sphere.
- Lesson 2: Mercator and navigation
- Core question: What geographic properties does the Mercator projection preserve?
- Activity: Demonstrate rhumb lines and discuss the concept of latitude-dependent scale.
- Evidence of learning: Student explains the distinction between preserving direction and preserving area, and identifies Mercator's strength for navigation.
- Lesson 3: Equal-area alternatives
- Core question: What precisely does ‘equal-area’ mean in cartography?
- Activity: Facilitate a direct comparison between Mercator, Gall–Peters, and Equal Earth projections.
- Evidence of learning: Student accurately defines 'equal-area' and identifies the associated shape trade-offs inherent in such projections.
- Lesson 4: Maps and history
- Core question: How do historical purpose and context influence map choices and their prevalence?
- Activity: Analyze primary sources such as historical navigation charts and early reference maps.
- Evidence of learning: Student can effectively differentiate between the documented historical use of a projection and subjective interpretations of its ideological design.
- Lesson 5: Critical map design
- Core question: Beyond projection, what other design elements can potentially mislead a map viewer?
- Activity: Conduct an audit of various map elements: labels, chosen center, cropping, color schemes, and underlying data representation.
- Evidence of learning: Student successfully completes a comprehensive map-critique checklist, identifying multiple layers of design choice.
- Lesson 6: Design challenge
- Core question: Which specific projection best fits a given real-world mapping task?
- Activity: Students create and verbally defend a thematic map (e.g., global forest cover) or a route map, justifying their projection choice.
- Evidence of learning: Student confidently justifies their projection selection with evidence-based reasoning, demonstrating an understanding of trade-offs.
Assessment rubric
To ensure consistent and meaningful evaluation, a rubric should focus on demonstrable skills rather than mere recall:
- Accuracy: Correctly distinguishes and explains the properties of area, shape, distance, and direction in map projections.
- Evidence: Cites at least one reliable cartographic or geographic source to support claims about projection properties or uses.
- Reasoning: Clearly explains why a chosen projection is suitable for its stated purpose, detailing its strengths.
- Critical thinking: Identifies at least one significant limitation or trade-off of a map without resorting to labeling it universally 'wrong' or 'biased.'
- Communication: Produces maps or explanations using clear labels, a legible legend, a source note, and explicit projection metadata.
Downloadable Lesson Plan: Every Map Makes a Choice
This practical lesson plan, suitable for general family learning or upper-primary to secondary geography, guides learners through the core concepts of map projection literacy.
- Audience: General family learning or upper-primary to secondary geography.
- Suggested duration: 60–75 minutes.
- Materials: A physical globe, three printed world maps (Mercator, Gall–Peters, Equal Earth), a ruler, transparent paper, colored pencils, and a reliable atlas or digital geographic data source.
- Learning objectives:
- Explain why every flat world map inherently involves distortion.
- Describe the fundamental difference between conformal and equal-area projection goals.
- Compare Mercator, Gall–Peters, and Equal Earth without claiming any single one is perfect.
- Select an appropriate projection for a stated mapping task and articulate the reasoning behind that decision.
- Procedure:
- Warm-up (10 minutes): Ask learners to visually compare a globe with a flat world map and write down one 'visual surprise' or discrepancy they observe.
- Mini-lesson (10 minutes): Briefly explain the challenge of sphere-to-plane distortion and introduce the USGS principle that no flat map can preserve everything simultaneously.
- Investigation (20 minutes): Students actively compare the three provided projections, completing a table with columns for observed characteristics related to area, shape, direction, distance, and likely appropriate uses for each map.
- Evidence check (10 minutes): Using an atlas or reliable geographic dataset, students verify the relative sizes of selected regions (e.g., Africa vs. Greenland), contrasting with their visual impressions from the non-equal-area map.
- Design challenge (15 minutes): Students choose a projection that would be most appropriate for a specific task, such as plotting a sailing route, creating a global land-cover map, or designing a regional planning map, and briefly defend their choice.
- Exit ticket (5 minutes): Students complete the sentence: 'The best projection is not universal because…'
- Discussion prompts:
- Why might a sea navigator prioritize accurate direction over accurate area representation?
- What makes an area-preserving design essential for a map depicting global forest cover?
- Is it possible for a map to be mathematically accurate but still difficult to read or interpret effectively?
- How can simply changing a map's centering or orientation alter which geographical relationships are most easily perceived?
- Distinguish: Which claims about maps are supported by verifiable evidence, and which would require extensive further research to substantiate?
- Teacher note: It's critical to avoid framing this lesson as a contest between a 'bad' northern map and a 'good' southern map. The most robust learning outcome is the student's developed ability to accurately match a projection to its specific purpose, to clearly identify its inherent trade-offs, and to differentiate objective mathematical distortion from more subjective claims about social or political impact.
Education FAQs: Mastering Map Literacy
Is the Mercator projection wrong?
Does Equal Earth show the exact shape of every country?
Does Mercator prove that Europe is more important than Africa?
Which projection is best for a map of global population density?
Should schools stop teaching the Mercator projection?
Disclaimer: This article discusses educational topics for informational purposes only. The content is not intended to serve as professional academic counseling or career guidance. Images and examples are illustrative and may be simplified for explanation purposes. Please consult our full disclaimer for more information.